Chart Gallery
Six charts summarise the market, the competition, the product and the economics. Each chart is available in English and Arabic.
1. Market growth
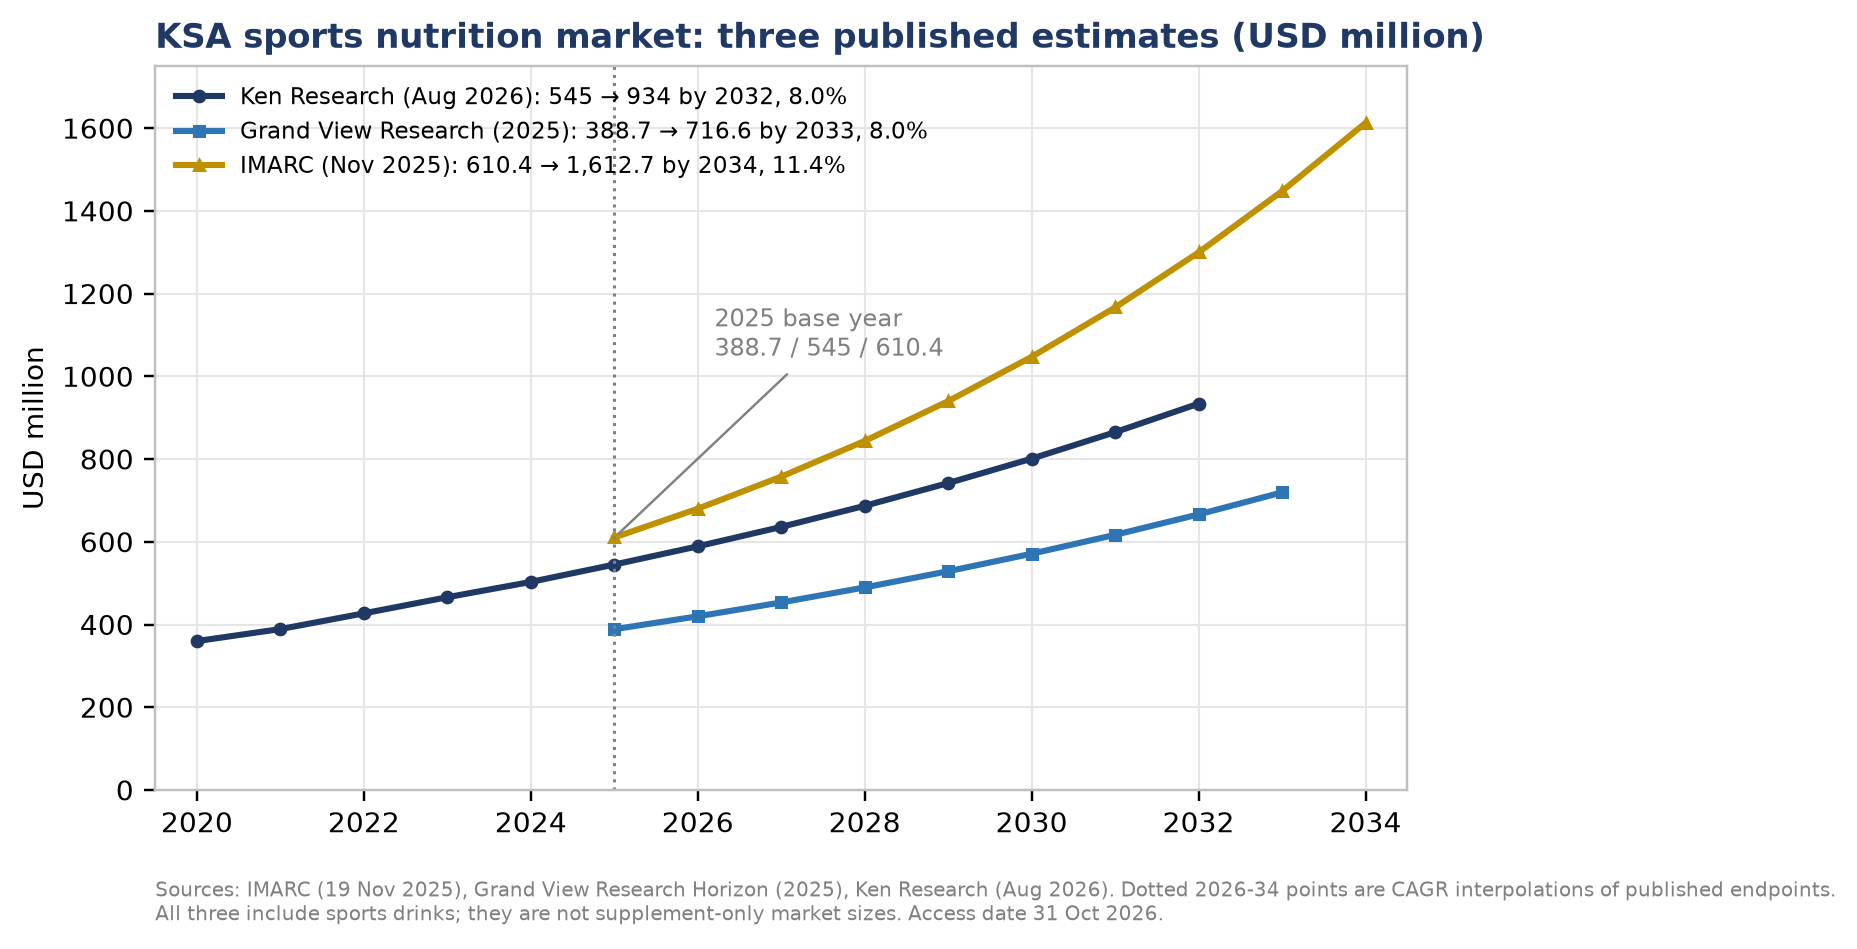
What it shows: three published estimates of the Saudi sports-nutrition market (USD 389 m, 545 m and 610 m in 2025). Dotted points are CAGR interpolations. All three include sports drinks.
Why it matters: it sets the planning anchor (USD 545 m) and the range the sensitivity must absorb.
2. Price per gram of protein
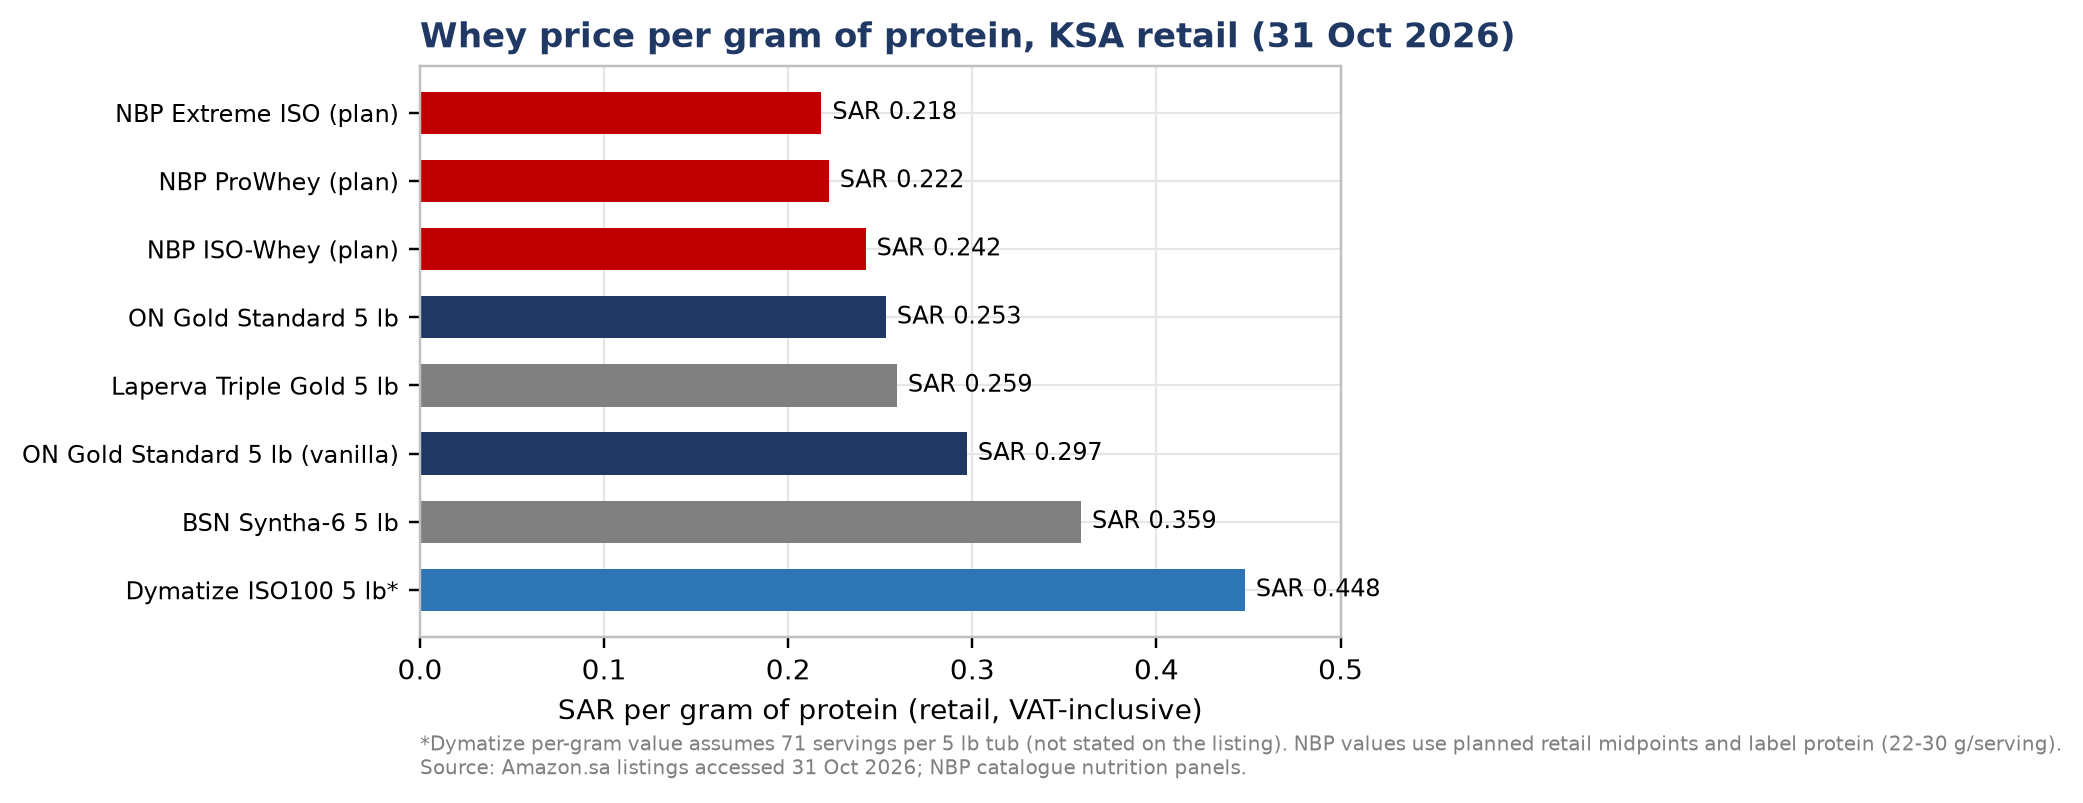
What it shows: retail price per gram of protein in KSA. NBP ProWhey is SAR 0.222, versus SAR 0.253 for ON and SAR 0.297 for the market median.
Why it matters: this is NBP's strongest value proof and the core of the marketing message.
3. Positioning map
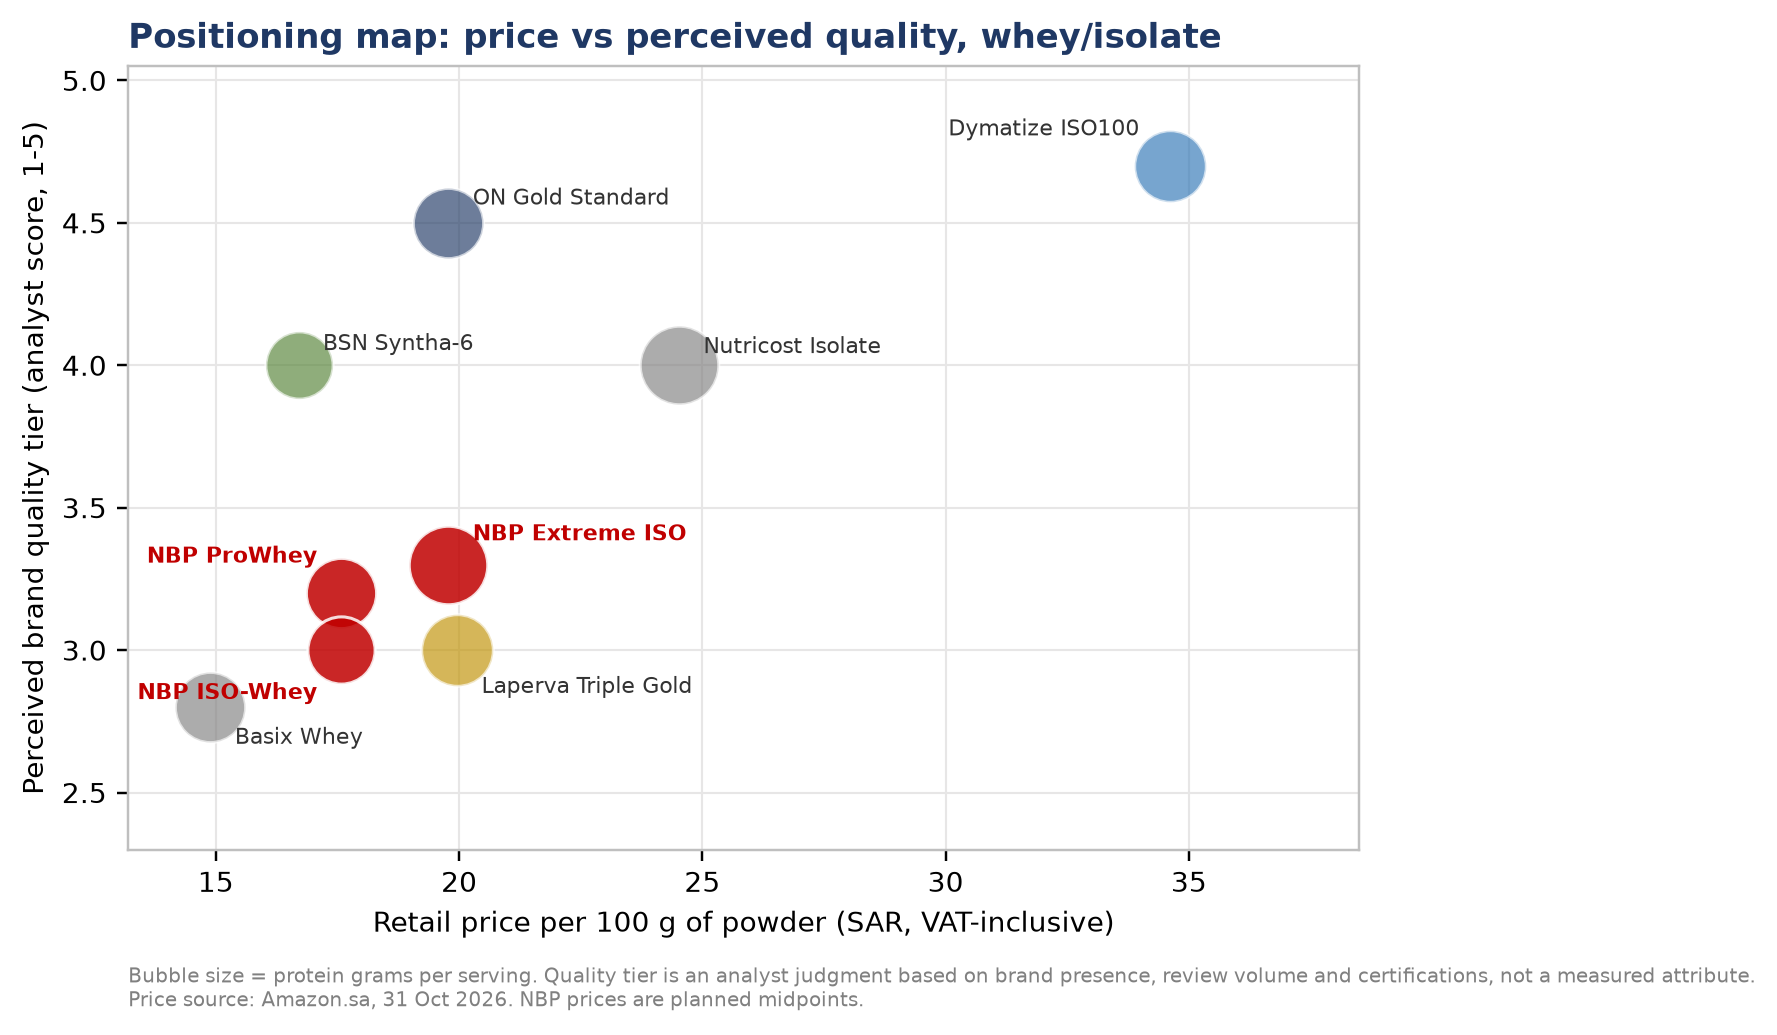
What it shows: price per 100 g against perceived quality; bubble size = protein per serving.
Why it matters: it places NBP in the "value challenger" space — cheaper than ON, with lower perceived quality.
4. Margin waterfall
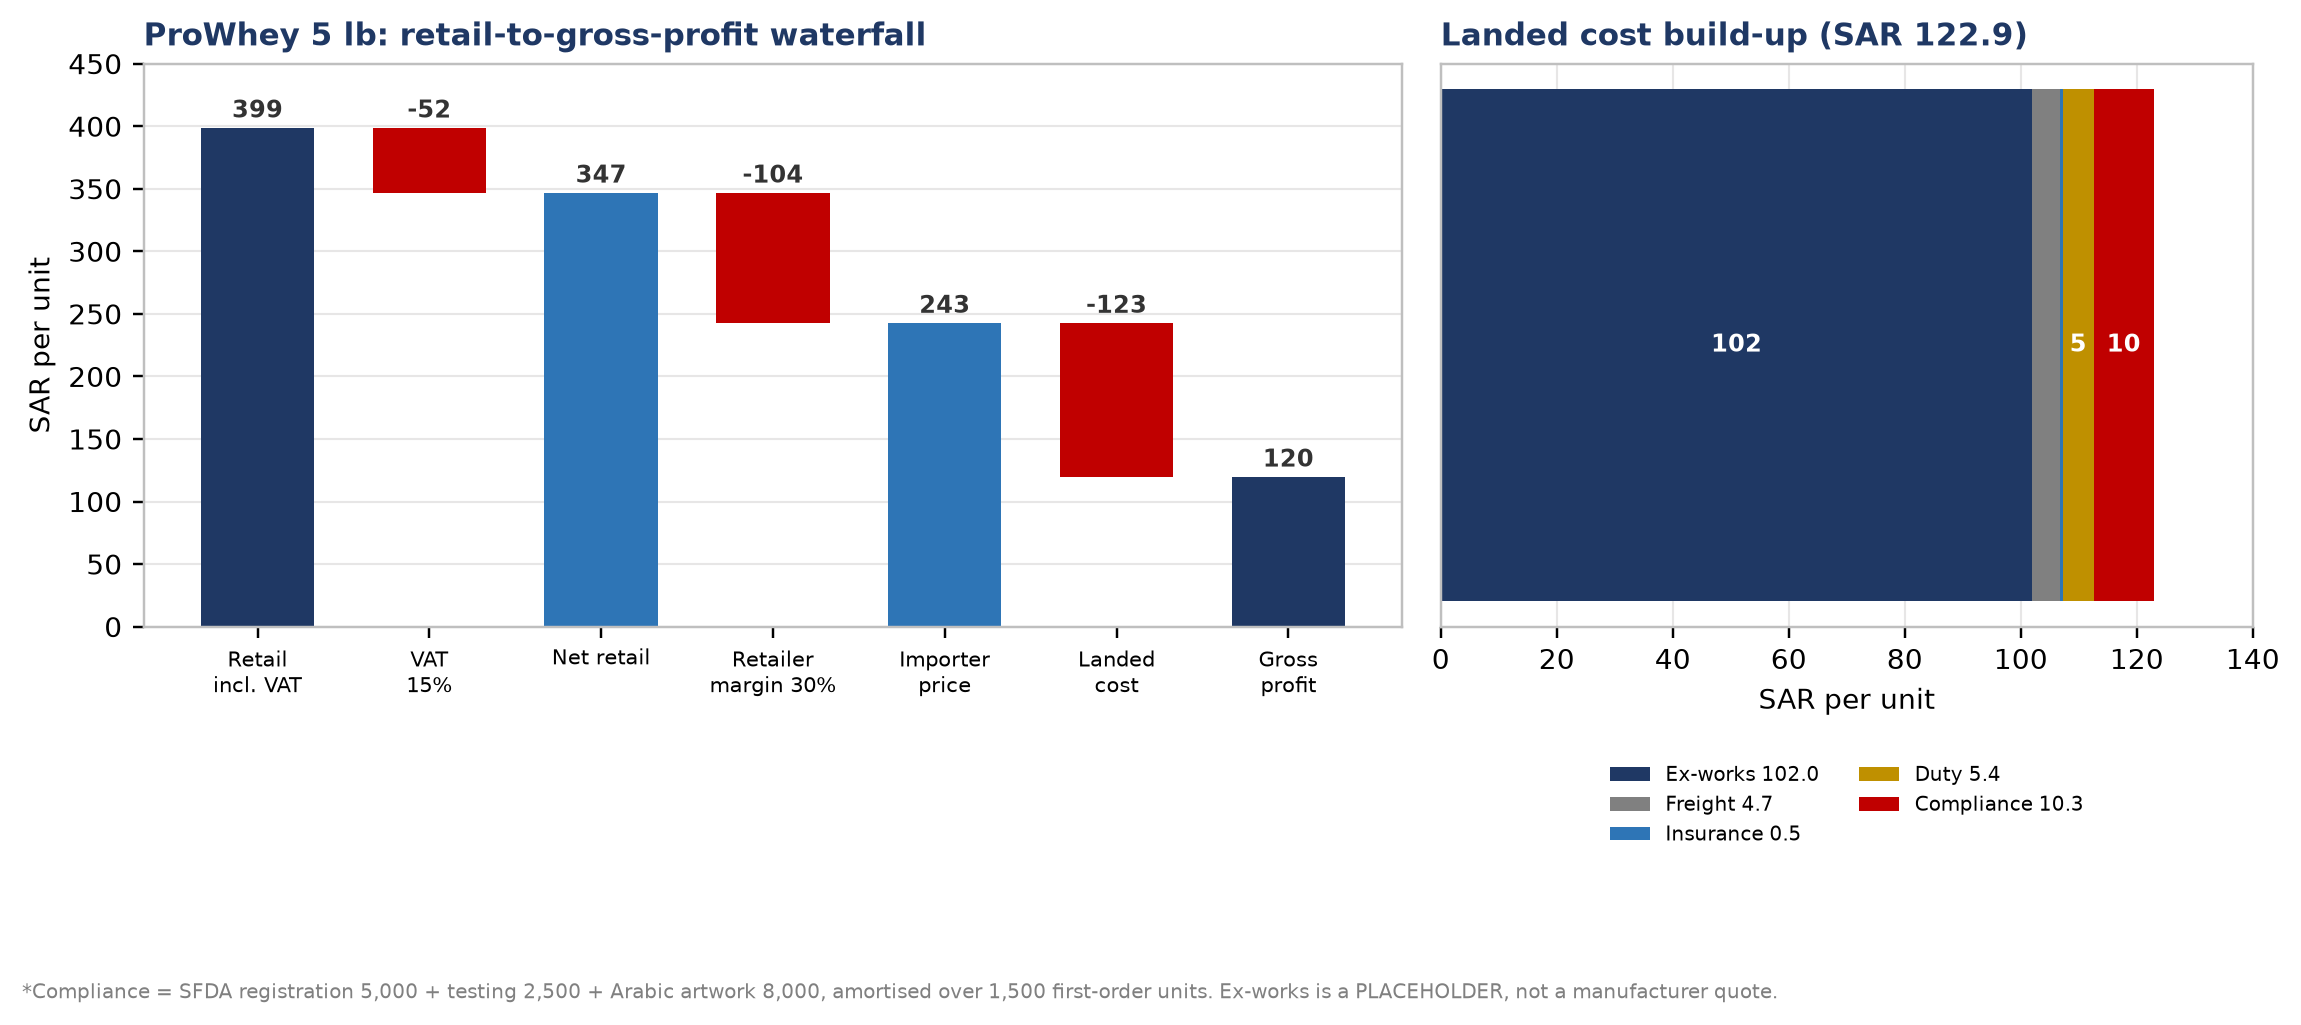
What it shows: from SAR 399 retail to SAR 120 gross profit for ProWhey, after VAT, retailer margin and landed cost.
Why it matters: it proves SAR 399 still leaves a healthy margin despite undercutting ON.
5. Scorecard radar
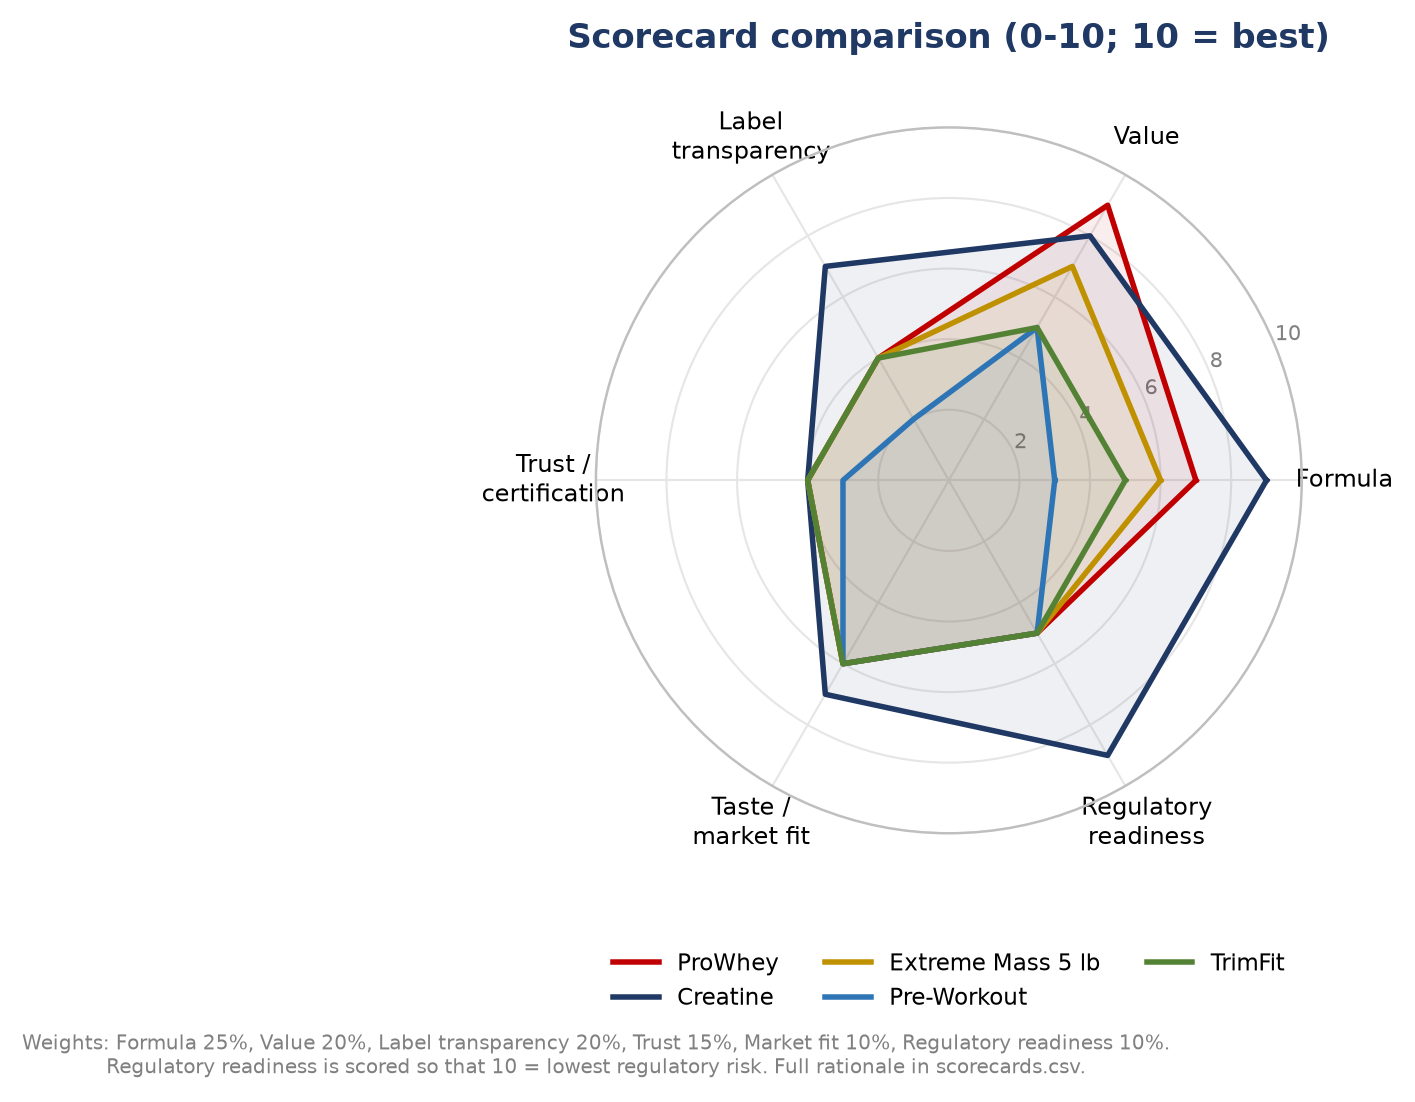
What it shows: five SKUs across six criteria: formula, value, label transparency, trust, market fit, regulatory readiness.
Why it matters: creatine and ProWhey lead; Extra Pump+ and Lipofel trail.
6. Market reconciliation
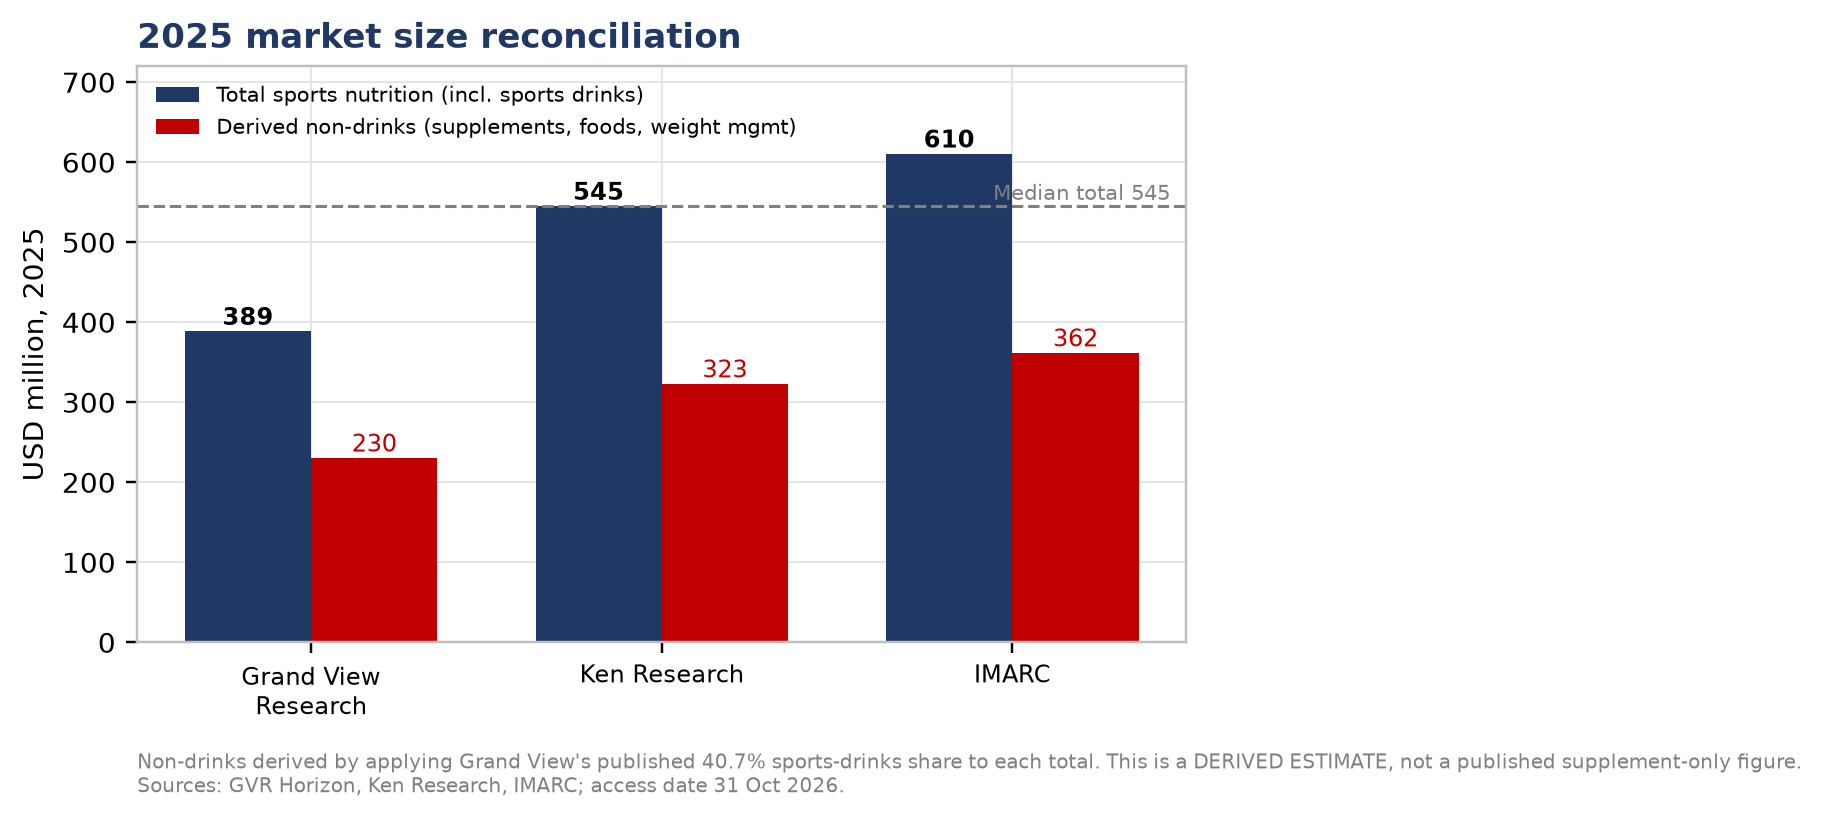
What it shows: the 2025 total and the derived non-drinks segment (applying the 40.7% sports-drinks share).
Why it matters: it explains why the target supplement market is ~USD 323 m, not USD 545 m.