Product Benchmark
Prepared: 31 October 2026 · Data: catalogue nutrition panels (read visually from the image-only PDF), Amazon.sa retail prices, Health Canada LNHPD records, published position stands
Bottom line. NBP's protein economics are genuinely competitive: ProWhey at a planned SAR 399 delivers protein at SAR 0.222/g, below ON Gold Standard (0.253), Laperva (0.259) and BSN Syntha-6 (0.359). Creatine is a clean, correctly dosed 5 g monohydrate. But the range is not uniformly good: Pre-Workout's ingredients add up to 6.47 g in a 5 g serving, BCAA delivers 1.2 g/day, L-Arginine 1.5 g/day, Lipofel 870 mg/day of garcinia, and Extra Pump+ spreads 19 ingredients across 4–6 capsules at sub-therapeutic doses. The scorecard ranks Creatine first (7.45/10), ProWhey second (6.05), and Extra Pump+ last (2.30). The product strategy should follow the scorecard, not the catalogue order.
1. Method and data quality
- Catalogue:
Catalogue_Performance_Line_1_10_2026_C_ENG.pdf, 18 pages, image-only (no text layer). Pages were rendered at 170 dpi and read visually, including nutrition panels. Values were transcribed intoproducts.csv. - Prices: Amazon.sa listings, accessed 31 Oct 2026, VAT-inclusive consumer prices. 81 rows in
benchmark_prices.csv(69 market listings + 12 NBP planning rows). Stock status was not verified; a listed price is not a guarantee of availability. - Canadian licences: Health Canada LNHPD product pages for all 11 printed NPNs, accessed 31 Oct 2026 [S9].
- Evidence: ISSN position stands and systematic reviews, via Europe PMC/PubMed identifiers [S24–S34].
- Limitations: no independent lab testing was performed; no NBP product was physically sampled; no sensory panel; no review data for NBP (brand not sold in KSA). All NBP prices are planning midpoints, not market quotes.
2. Formula audit, SKU by SKU
2.1 Extreme Mass Gainer (5 lb / 10 lb)
| Metric | Value | Comment |
|---|---|---|
| Serving | 375 g (5 scoops) | Very large; 1,582 kcal |
| Protein | 60 g | 16.0 g/100 g; 15.2% of energy |
| Carbohydrate | 284 g | 75.7% of product |
| Sugars | 60 g | 16.0 g/100 g; 15.2% of energy |
| Fat | 8 g | 2.1 g/100 g |
| Creatine | 2.5 g | Below the 3–5 g/day evidence dose |
| Glutamine | 834 mg | Subclinical |
| Fibre | 7.5 g | 2.0 g/100 g |
| Sodium | 550 mg | 147 mg/100 g |
| Calories per g protein | 26.4 | High; protein is a minority of calories |
| Servings per 2.27 kg | 6.05 | A 5 lb bag lasts 6 days at one serving/day |
| Servings per 4.54 kg | 12.1 | 10 lb bag lasts 12 days |
Formula read. This is a maltodextrin/fructose/dextrose product with whey at number two. It will do what a mass gainer is supposed to do — deliver a calorie surplus — but the 60 g sugar and 375 g serving are out of step with current formulation norms. The protein claim is the weakest part: at 15.2% of energy it qualifies as a "source of protein" but not "high protein" under SFDA.FD 2333's 20% threshold [S6]. The front-of-pack "60 g protein" is true per serving but flatters a product that is 76% carbohydrate.
Commercial read. At SAR 219 for 5 lb, it is at parity with ON Serious Mass 6 lb (SAR 222) but gives 17% less product; the 10 lb at SAR 399 is the better value (SAR 8.79/100 g vs ON 12 lb 7.70). Mass gainers are compared per kg, so the 5 lb pack is structurally weak.
2.2 Extreme ISO (5 lb)
| Metric | Value | Comment |
|---|---|---|
| Serving | 33 g | 1–2 scoops |
| Protein | 30 g | 90.9 g/100 g |
| Nutrition panel | None published | Calories, carbs, fat, sugar, sodium missing |
| Servings per 2.27 kg | 68.8 | Label does not state servings |
| Canadian licence | Whey isolate 60 g at 90% protein | Catalogue 33 g/30 g; dose mismatch |
Formula read. If the 30 g protein per 33 g scoop is accurate, this is a genuine isolate at 91% protein — the best protein density in the range. But there is no nutrition panel, no servings count, and the Canadian licence records a 60 g dose, not 33 g. A buyer cannot verify calories, carbs, fat or sugar. This is a label transparency failure, not necessarily a formula failure.
2.3 ISO-Whey 100% (5 lb)
| Metric | Value | Comment |
|---|---|---|
| Serving | 30 g | Panel says "33 and 67 servings" — inconsistent with 5 lb |
| Protein | 22 g panel / 24 g front | 73.3 g/100 g on the panel; 80 g/100 g on the front |
| Carbohydrate | 4 g | 1 g sugar |
| Fat | 1.5 g | 22.5 kcal from fat claimed — should be 13.5 |
| Calories | 126 | 5.73 kcal/g protein |
| Ingredients | WPC, maltodextrin, flavours, enzymes, stevia, sucralose | No isolate listed |
| Canadian licence | WPC only; no maltodextrin/enzymes | Formula mismatch |
Formula read. "ISO" and "100%" are not supported by the ingredient list: the protein source is whey concentrate, and maltodextrin is the second ingredient. A 73% protein powder is a respectable WPC blend, but it is not an isolate and not "100% whey protein". The front/panel protein gap (24 vs 22 g) and the serving-count error are exactly the kind of discrepancies SFDA label review catches.
2.4 ProWhey (5 lb)
| Metric | Value | Comment |
|---|---|---|
| Serving | 30 g, 75 servings | 2,270 g ÷ 30 g = 75.7; consistent |
| Protein | 24 g | 80.0 g/100 g; 76.2% of energy |
| Carbohydrate | 4 g | 0 g sugar |
| Fat | 1.5 g | 13.5 kcal (panel says 22.5) |
| Calories | 126 | 5.25 kcal/g protein |
| Ingredients | WPC, natural flavour, stevia, sucralose; cacao in chocolate | WPC-only |
| Canadian licence | NPN 80054471 belongs to Iso-Whey, not ProWhey | No licence for this product |
Formula read. 80% protein from a WPC-only blend is at the upper bound of what WPC can deliver; it is possible with a high-protein WPC80 and no filler, but it leaves little room for flavour or cacao. The panel is internally consistent on calories (24×4 + 4×4 + 1.5×9 = 125.5), except for the fat-calorie line. The commercial value is excellent (SAR 0.222/g protein), but the licence problem must be fixed.
2.5 Pre-Workout (480 g)
| Ingredient | Per 5 g serving | Effective dose? | Comment |
|---|---|---|---|
| Caffeine | 50 mg | Low | 3–6 mg/kg is the performance dose; 50 mg is ~0.6 mg/kg for an 80 kg adult |
| Beta-alanine | 1.0 g | No | 3.2–6.4 g/day needed [S26] |
| Creatine | 3.0 g | Below | 3–5 g/day; 3 g is at the low end [S25] |
| L-Arginine | 1.5 g | No | 6–8 g studied; citrulline is superior [S29] |
| Taurine | 100 mg | No | Subclinical |
| L-Tyrosine | 200 mg | No | Subclinical |
| L-Leucine | 150 mg | No | Subclinical |
| L-Valine | 250 mg | No | Subclinical |
| L-Isoleucine | 100 mg | No | Subclinical |
| L-Phenylalanine | 15 mg | No | Trace |
| Vitamin B9 | 200 µg | Yes | 50% NRV |
| Vitamin B12 | 15 µg | Yes | 600% NRV |
| Vitamin C | 100 mg | Yes | 125% NRV |
| Total actives | ~6.47 g | 129% of the 5 g serving | Physically impossible without a larger scoop |
Formula read. The mass balance is the headline defect: 6.47 g of active ingredients cannot fit in a 5 g serving. Either the scoop is ~6.5 g or the doses are per larger serving; either way the label is wrong. Beyond that, the formula is a "fairy dust" pre-workout: 13 ingredients, most below effective doses, with a low caffeine content. It is not dangerous; it is unlikely to deliver the experience a pre-workout buyer expects.
2.6 Creatine Monohydrate (400 g)
| Metric | Value | Comment |
|---|---|---|
| Serving | 5 g | 80 servings |
| Creatine | 5 g | 100% of serving |
| Calories | 0 | — |
| Dose | 5 g/day; loading 3–5 g/day; maintenance 2–5 g/day | Loading text is wrong (standard loading is ~20 g/day for 5–7 days) |
| Price per g creatine (plan) | SAR 0.273 | Market median SAR 0.298 |
Formula read. The best product in the range: single ingredient, correct 5 g dose, 80 servings, and a price below the market median per gram. The only issues are label copy ("L-CREATINE", fatty-acid metabolism text copied from carnitine) and the loading protocol. These are cheap to fix.
2.7 L-Arginine (180 caps)
| Metric | Value | Comment |
|---|---|---|
| Serving | 3 caps = 1.5 g | 500 mg/cap |
| Total arginine | 90 g | 60 servings |
| Price per g (plan) | SAR 1.10 | Market median SAR 0.89 |
| Evidence dose | 6–8 g | 1.5 g is ~20–25% of studied dose |
| Claims | NO vasodilator; growth hormone release | Not permitted as food claims |
Formula read. Underdosed and overclaimed. Arginine is also the wrong lever: oral arginine is poorly converted to NO; citrulline is the better substrate [S29]. A 3–5 g arginine or 6–8 g citrulline malate product would be defensible; 1.5 g is not.
2.8 BCAA 2:1:1 (180 caps)
| Metric | Value | Comment |
|---|---|---|
| Serving | 3 caps = 600 mg (300 leu / 150 val / 150 ile) | 200 mg/cap |
| Daily dose | 6 caps = 1.2 g | 30 servings |
| Total BCAA | 36 g | — |
| Price per g (plan) | SAR 3.58 | ON/Type Zero ~SAR 0.77/g |
| Evidence dose | 5–10 g/day | 1.2 g is ~12–24% of studied dose |
Formula read. The worst value in the range: 36 g of BCAA for SAR 129, at 4.7× the market price per gram, with a dose far below the literature [S30]. The product also carries the wrong description (carnitine text on the BCAA page and vice versa). Not a launch SKU.
2.9 L-Carnitine (180 caps)
| Metric | Value | Comment |
|---|---|---|
| Serving | 3 caps = 2 g L-carnitine tartrate | ~1.31 g L-carnitine |
| Total | 120 g tartrate | 60 servings |
| Price per g (plan) | SAR 0.99 | Market median ~SAR 1.62 (skewed); Dr Martin's 0.55 |
| Evidence | Modest for recovery; weak for fat loss [S28] | 2–4 g/day studied |
| Licence | Acetyl-L-carnitine, not tartrate | Form mismatch |
Formula read. Mid-pack value, weak evidence for the "fat metabolism" claim, and a Canadian licence that names a different carnitine form. The "4 hours before exercise" timing is not supported by the literature. Reposition as a recovery/amino product, not a fat burner.
2.10 Extra Pump+ (180 caps)
| Metric | Value | Comment |
|---|---|---|
| Serving | 4–6 caps; not defined | 30–45 servings |
| Caffeine | 33 mg per cap (LNHPD) | 132–198 mg/day at 4–6 caps |
| Creatine | 334 mg/cap | 1.3–2.0 g/day; below dose |
| Beta-alanine | Not listed | — |
| Botanicals | Eleuthero 50 mg, ginkgo 60 mg, maca 40 mg, salix alba 20 mg, tribulus 60 mg | All subclinical; salix is the risk |
| Total ingredients | 19 | "Kitchen sink" formulation |
| Price per serving (plan) | SAR 3.31–4.97 | — |
Formula read. The most problematic SKU. Nineteen ingredients, most at doses too low to matter, plus Salix alba (willow bark) with a label warning against anticoagulants, aspirin, ibuprofen, fish oil and vitamin E. That warning is appropriate for a medicine, not a pre-workout. The caffeine dose is also understated in the catalogue because the LNHPD confirms 33 mg per capsule, not per 4–6 capsule serving. Not launchable without reformulation.
2.11 Lipofel (90 caps)
| Metric | Value | Comment |
|---|---|---|
| Serving | 1–3 caps | 30–90 servings |
| Garcinia | 150 mg + Malabar tamarind 140 mg = 290 mg/cap | Same plant twice; licence says 140 mg of a 5:1 extract |
| Green coffee | 150 mg/cap | 450 mg/day at 3 caps |
| L-Carnitine | 340 mg/cap | 1.02 g/day |
| Chromium | 100 µg/cap | 300 µg/day at 3 caps (high) |
| Vitamin B6 | 10 mg/cap | 30 mg/day at 3 caps; high |
| Price per g garcinia (plan) | SAR 10.3 | Solaray SAR 4.60 |
| Evidence | Garcinia: weak, mixed, safety signals [S31]; green coffee: weak [S32] | — |
Formula read. A "slimming" capsule with a double-counted botanical, subclinical doses, high chromium/B6 and claims that SFDA does not permit for sport foods. At 3 caps/day the garcinia dose is 870 mg, below the 1,500 mg used in trials, and the extract is not standardised to 50% HCA as the licence requires. Not launchable as formulated.
2.12 TrimFit (454 g)
| Metric | Value | Comment |
|---|---|---|
| Serving | 20 g | 22.7 servings |
| Protein | 12 g | 60 g/100 g; 60% of energy |
| Calories | 80 | Not a meal replacement (typical 200–250 kcal) |
| Fibre | 2 g | — |
| Resveratrol | 20 mg | Licence says 40 mg |
| Vitamin C | 20 mg | Licence says 100 mg |
| Vitamin D | 5 µg | Licence says 10 µg |
| Vitamin B6 | 2 mg | Licence says 4 mg |
| Price per 100 g (plan) | SAR 39.4 | Herbalife 27.0; Garden of Life 39.1 |
Formula read. A low-calorie protein/fibre powder, not a meal replacement. The Canadian licence formula differs materially (more fibre, resveratrol, vitamins; 10 g WPC). The "healthy weight loss" and "meal complement" claims overstate what an 80 kcal scoop can do. Reposition as a protein/fibre supplement for between-meal use, or reformulate to 200–250 kcal with 20 g protein.
2.13 Pro Milk (pipeline)
| Metric | Value | Comment |
|---|---|---|
| Pack | 30 g sachet | 4 flavours |
| Protein | "35 g MILK PROTEIN" on back | Likely per 100 g → 10.5 g per 30 g sachet |
| Panel | Not legible / not final | No NPN |
| Positioning | Convenience protein sachet | Strong on-the-go fit for KSA |
Formula read. Cannot be assessed until the final panel is available. The "35 g" claim is ambiguous: if it is per 100 g, the sachet has 10.5 g protein, which is a snack not a protein serving. If it is per sachet, the sachet would be 117% protein, which is impossible. Clarify before launch.
3. Computed metrics summary
| SKU | Protein % of serving | Protein g/100 g | kcal per g protein | Sugar % energy | Servings/pack | Total protein/pack |
|---|---|---|---|---|---|---|
| Extreme Mass 5 lb | 16.0% | 16.0 | 26.4 | 15.2% | 6.1 | 363 g |
| Extreme Mass 10 lb | 16.0% | 16.0 | 26.4 | 15.2% | 12.1 | 727 g |
| Extreme ISO | 90.9% | 90.9 | n/a | n/a | 68.8 | 2,064 g |
| ISO-Whey | 73.3% | 73.3 | 5.7 | 3.2% | 75.7 | 1,650 g |
| ProWhey | 80.0% | 80.0 | 5.2 | 0% | 75.0 | 1,800 g |
| Pre-Workout | 0% | 0 | n/a | n/a | 96 | 0 |
| Creatine | 0% | 0 | n/a | n/a | 80 | 0 |
| L-Arginine | 0% | 0 | n/a | n/a | 60 | 0 |
| BCAA | 0% | 0 | n/a | n/a | 30 | 0 |
| L-Carnitine | 0% | 0 | n/a | n/a | 60 | 0 |
| Extra Pump+ | 0% | 0 | n/a | n/a | 30–45 | 0 |
| Lipofel | 0% | 0 | n/a | n/a | 30–90 | 0 |
| TrimFit | 60.0% | 60.0 | 6.7 | 0% | 22.7 | 272 g |
| Pro Milk | n/a | ~35 (if per 100 g) | n/a | n/a | 1 | ~10.5 g |
Full data, including ingredients, sweeteners, flavours, NPNs, claims and warnings, is in products.csv.
4. Value benchmark against the KSA market
4.1 Whey / isolate (the core comparison)
| Product | Price SAR | Size | Price/100 g | Protein/serving | Price/g protein |
|---|---|---|---|---|---|
| NBP Extreme ISO (plan) | 449 | 2.27 kg | 19.78 | 30 g | 0.218 |
| NBP ProWhey (plan) | 399 | 2.27 kg | 17.58 | 24 g | 0.222 |
| NBP ISO-Whey (plan) | 399 | 2.27 kg | 17.58 | 22 g | 0.242 |
| ON Gold Standard 5 lb | 449 | 2.27 kg | 19.78 | 24 g | 0.253 |
| Laperva Triple Gold 5 lb | 453 | 2.27 kg | 19.96 | 25 g | 0.259 |
| ON Gold Standard 5 lb (vanilla) | 521 | 2.27 kg | 22.95 | 24 g | 0.297 |
| BSN Syntha-6 5 lb | 379 | 2.27 kg | 16.70 | 22 g | 0.359 |
| Dymatize ISO100 5 lb | 796 | 2.30 kg | 34.61 | 25 g | 0.448* |
| Market median (n=6 with protein data) | — | — | 22.95 | — | 0.297 |
*Assumes 71 servings. NBP is 18–27% below the median price per gram of protein (ProWhey 25%, ISO-Whey 18%, Extreme ISO 27%). That is the strongest value proposition in the range.
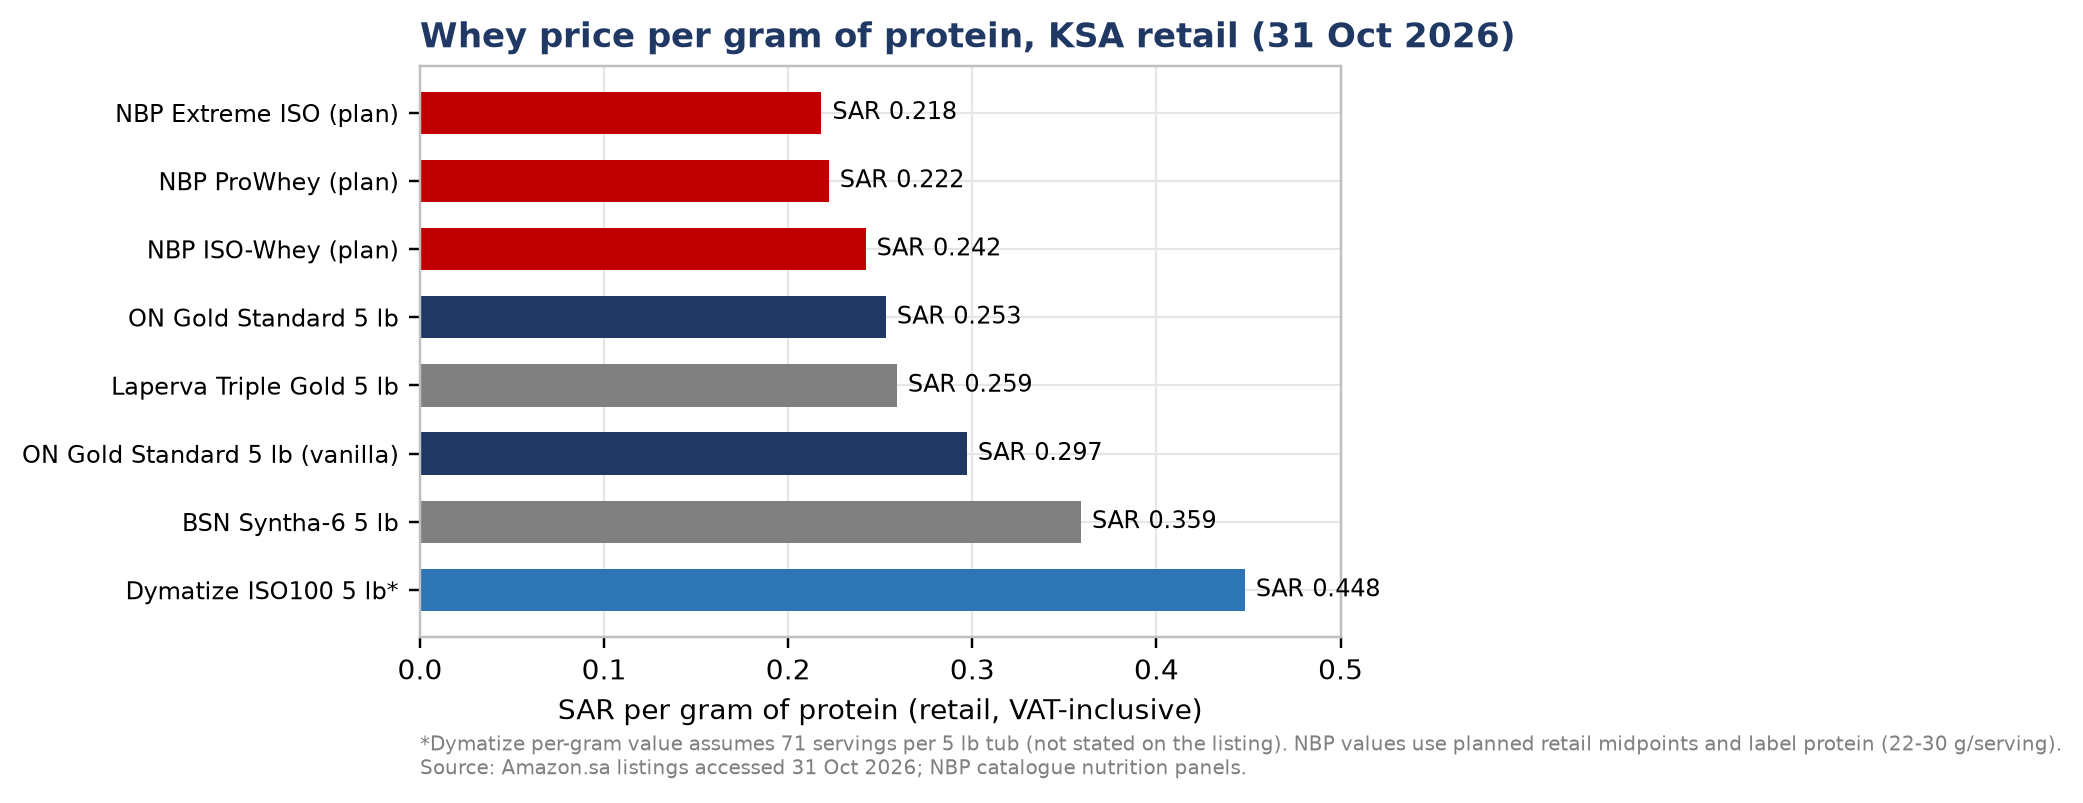
Figure 4. Retail price per gram of protein, KSA, 31 Oct 2026. NBP bars use planned midpoints.
4.2 Mass gainers
| Product | Price SAR | Size | Price/100 g | Price/g protein |
|---|---|---|---|---|
| Basix Gain 6 lb | 145 | 2.72 kg | 5.33 | n/a |
| ON Serious Mass 6 lb | 222 | 2.72 kg | 8.16 | 0.555 |
| NBP Extreme Mass 5 lb (plan) | 219 | 2.27 kg | 9.65 | 0.603 |
| Laperva Triple Mass 6 lb | 222 | 2.72 kg | 8.17 | n/a |
| MuscleTech Mass 5.15 lb | 241 | 2.34 kg | 10.33 | n/a |
| Dymatize Super Mass 6 lb | 295 | 2.72 kg | 10.84 | n/a |
| Applied Critical Mass 6 kg | 299 | 6.0 kg | 4.98 | n/a |
| NBP Extreme Mass 10 lb (plan) | 399 | 4.54 kg | 8.79 | 0.549 |
| ON Serious Mass 12 lb | 419 | 5.44 kg | 7.70 | 0.524 |
| Mutant Mass 5 lb | 629 | 2.27 kg | 27.71 | n/a |
NBP 10 lb is competitive; the 5 lb is not. Lead with 10 lb.
4.3 Creatine, pre-workout and capsules
| Category | NBP planned | Market range | NBP position |
|---|---|---|---|
| Creatine 400 g | SAR 109 (27.3/100 g) | 104–129 (26.0–32.3/100 g) | Mid-pack, good |
| Pre-workout 480 g | SAR 159 (SAR 1.66/serving) | 94–212 (SAR 3.13–7.07/serving) | Cheap per serving; underdosed |
| BCAA 180 caps | SAR 129 (SAR 3.58/g) | 0.77–2.30/g | Worst value |
| L-Arginine 180 caps | SAR 99 (1.10/g) | 0.89–1.21/g | Above median |
| L-Carnitine 180 caps | SAR 119 (0.99/g) | 0.55–1.62/g | Below median, good |
| Lipofel 90 caps | SAR 139 (10.3/g garcinia) | 4.60/g (Solaray) | Poor value |
| TrimFit 454 g | SAR 179 (39.4/100 g) | 27.0–39.1/100 g | Premium end |
5. Evidence check by active ingredient
Grades: Strong = multiple RCTs/meta-analyses and a position stand; Adequate = some RCT support, effect size modest; Weak = limited/inconsistent evidence; Marketing-driven = no meaningful evidence at the dose used.
| Ingredient | NBP dose | Evidence grade | What the literature supports | NBP verdict |
|---|---|---|---|---|
| Whey protein | 22–30 g/serving | Strong | 1.6–2.2 g/kg/day; 20–40 g per meal supports muscle protein synthesis [S24] | Strong for ProWhey/Extreme ISO; Adequate for ISO-Whey (WPC blend) |
| Creatine monohydrate | 5 g/day (creatine SKU); 2.5–3 g (others) | Strong | 3–5 g/day increases strength/lean mass; loading 20 g/day × 5–7 days optional [S25] | Strong for Creatine; Weak in Mass/Pre-Workout |
| Beta-alanine | 1 g | Strong at 3.2–6.4 g/day | Improves high-intensity exercise capacity [S26] | Weak at 1 g |
| Caffeine | 50 mg | Strong at 3–6 mg/kg | Improves endurance, power, alertness [S27] | Low dose, not harmful |
| L-citrulline / arginine | 1.5 g arginine | Adequate for citrulline 6–8 g; weak for arginine | Citrulline malate improves performance; oral arginine is poorly converted to NO [S29] | Weak |
| BCAA | 1.2 g/day | Weak/Adequate | May reduce DOMS; no clear advantage over whole protein [S30] | Weak at 1.2 g |
| L-carnitine | 1.31 g/day | Adequate for recovery; weak for fat loss | May reduce muscle damage; not a fat burner [S28] | Weak for the claim |
| Garcinia cambogia | 870 mg/day max | Weak | Modest, inconsistent weight loss; GI/liver safety signals [S31] | Marketing-driven at this dose/extract |
| Green coffee | 450 mg/day | Weak | Small, heterogeneous effects [S32] | Weak |
| Tribulus terrestris | 60 mg | Weak | Inconsistent testosterone/performance effects [S33] | Marketing-driven |
| Maca | 40 mg | Weak | Some sexual-function RCTs at 1.5–3 g; nothing at 40 mg [S34] | Marketing-driven |
| Ginkgo biloba | 60 mg | Weak for performance | Cognitive claims, not exercise performance | Marketing-driven |
| Salix alba | 20 mg | Not supported | No exercise-performance evidence; salicin safety concerns | Remove |
Formulation verdict. The protein and creatine products are evidence-based. The pre-workout is underdosed. The amino capsules are underdosed. The botanical/slimming products are marketing-driven at the doses used. This is a portfolio of two good products, three adequate ones, and a long tail of weak ones.
6. Scorecards
Weights: Formula 25%, Value 20%, Label transparency 20%, Trust/certification 15%, Taste/market fit 10%, Regulatory readiness 10%. Scores 0–10, 10 = best; Regulatory readiness is scored so 10 = lowest risk. Full rationale in scorecards.csv.
| Rank | SKU | Formula | Value | Label | Trust | Market fit | Regulatory | Weighted |
|---|---|---|---|---|---|---|---|---|
| 1 | Creatine 400 g | 9 | 8 | 7 | 4 | 7 | 9 | 7.45 |
| 2 | ProWhey 5 lb | 7 | 9 | 4 | 4 | 6 | 5 | 6.05 |
| 3 | Extreme ISO 5 lb | 8 | 8 | 2 | 4 | 7 | 4 | 5.70 |
| 4 | Extreme Mass 10 lb | 6 | 8 | 4 | 4 | 6 | 5 | 5.60 |
| 5 | Extreme Mass 5 lb | 6 | 7 | 4 | 4 | 6 | 5 | 5.40 |
| 6 | ISO-Whey 5 lb | 6 | 9 | 2 | 3 | 7 | 3 | 5.15 |
| 7 | L-Carnitine 180 | 4 | 8 | 3 | 4 | 5 | 7 | 5.00 |
| 8 | Pro Milk (pipeline) | 6 | 6 | 2 | 4 | 7 | 6 | 5.00 |
| 9 | TrimFit 454 g | 5 | 5 | 4 | 4 | 6 | 5 | 4.75 |
| 10 | L-Arginine 180 | 3 | 5 | 5 | 4 | 5 | 6 | 4.45 |
| 11 | Pre-Workout 480 g | 3 | 5 | 2 | 3 | 6 | 5 | 3.70 |
| 12 | BCAA 180 | 2 | 2 | 4 | 4 | 5 | 7 | 3.50 |
| 13 | Lipofel 90 | 2 | 3 | 4 | 3 | 4 | 1 | 2.85 |
| 14 | Extra Pump+ 180 | 2 | 3 | 2 | 2 | 4 | 1 | 2.30 |
Reading the scorecard. Creatine wins because it is simple, correctly dosed, competitively priced and low-risk. ProWhey wins on value but loses on label transparency and regulatory readiness. Extreme ISO has the best protein density but the worst panel transparency. Extra Pump+ and Lipofel are last because they are both weak formulas and high regulatory risk.
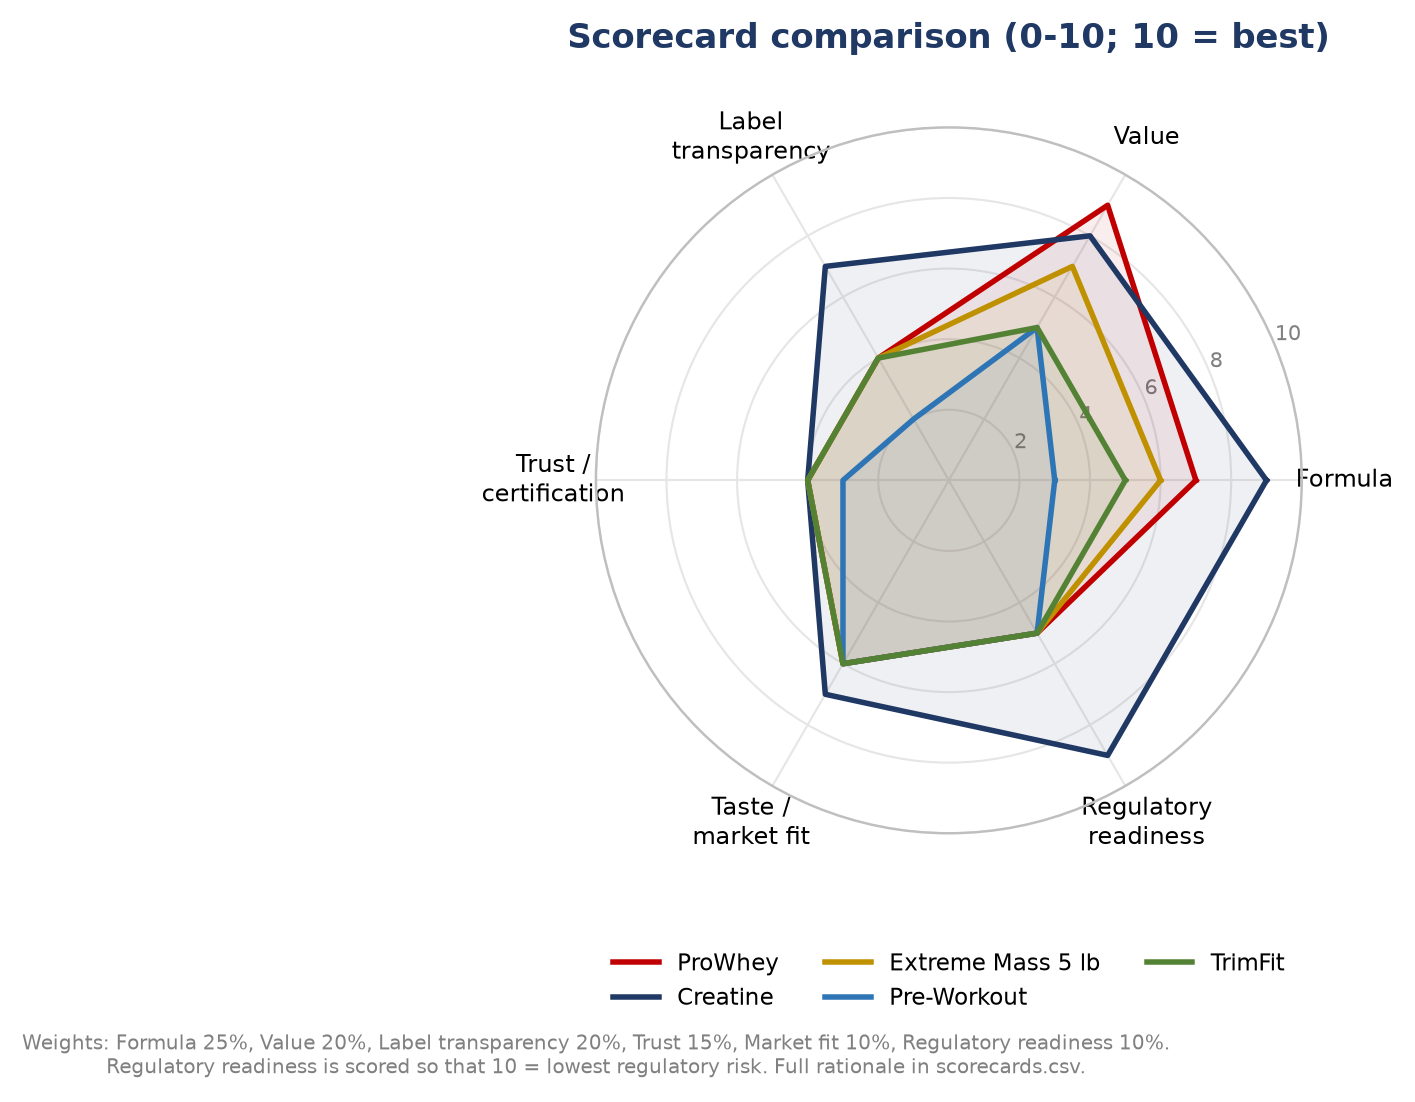
Figure 5. Scorecard comparison for the five most relevant SKUs. Weights: Formula 25%, Value 20%, Label 20%, Trust 15%, Market fit 10%, Regulatory 10%.
7. Recommended independent lab testing (pre-order condition)
Do not place a purchase order until three production batches of the launch SKUs have been tested by an ISO 17025 laboratory in addition to the manufacturer's CoA. Use unannounced sampling; do not accept a CoA supplied only by the brand.
| Test | Method | Acceptance | Why |
|---|---|---|---|
| Protein content | Kjeldahl or Dumas, duplicate | ±10% of label; ≥ label claim | Detect amino spiking/underfill |
| Amino acid profile | HPLC | Sum of amino acids ≈ protein; no glycine/taurine spike | Detect cheap nitrogen fillers |
| Creatine purity | HPLC | ≥99.5% monohydrate; creatinine/dicyandiamide within limits | Detect degradation |
| Heavy metals | ICP-MS (Pb, Cd, As, Hg) | Against GSO/SFDA contaminant limits | Saudi clearance and brand safety |
| Microbiology | TAMC, TYMC, E. coli, Salmonella, S. aureus | GSO 1016 / SFDA criteria | Mandatory food safety |
| Melamine | LC-MS/MS | Below limit | Dairy/protein supply-chain risk |
| Pesticides | GC-MS/MS / LC-MS/MS | Against GSO 382 | Botanical SKUs (Extra Pump+, Lipofel) |
| Banned substances | WADA prohibited-list panel (SARMs, steroids, stimulants, diuretics) | None detected | Sport positioning/trust |
| Caffeine assay | HPLC | Match label; per serving | Pre-Workout, Extra Pump+ |
| Stability | 25 °C/60% RH and 40 °C/75% RH at 0/3/6/12/24 months | Assay within spec; no micro growth | Saudi summer/warehouse |
Sampling plan: 3 batches × 3 launch SKUs (Creatine, ProWhey, Extreme Mass) = 9 sets; budget SAR 2,000–6,000 per SKU (ESTIMATE). Add Pre-Workout once the serving size is fixed.
What to do with the results: publish a QR-linked certificate on the Arabic label/website. In a market where NBP has no brand equity, a lab certificate is a stronger trust signal than an NPN — especially given the NPN audit findings.
8. Benchmark conclusions
- Lead with protein and creatine. They are the only categories where NBP's price per gram and formula are both competitive.
- Do not launch the capsule range as-is. BCAA and arginine are underdosed and overpriced; Lipofel and Extra Pump+ are regulatory liabilities.
- Fix the labels before the lab tests. Testing a product whose label says 24 g when the panel says 22 g wastes money; decide the formula first.
- Use the 10 lb mass gainer as the hero, not the 5 lb.
- Price at SAR 399 for ProWhey and SAR 109 for Creatine. Both are below the market median per gram and still deliver ~49% gross margin at retail (Section 05).
- Independent testing is non-negotiable. It is the only way to convert "Canadian NPN" into credible quality evidence after the NPN audit.
Key sources for this chapter
[S6] SFDA, A Guide to Nutrition and Health Claims — https://oldsfda.sfda.gov.sa/sites/default/files/2021-04/AGuidetoNutritionClaims.pdf [S9] Health Canada LNHPD — https://health-products.canada.ca/lnhpd-bdpsnh/info?licence=80054471 [S13] Amazon.sa listings, 31 Oct 2026 — https://www.amazon.sa/ [S24] ISSN protein position stand, PMID 28642676 — https://pubmed.ncbi.nlm.nih.gov/28642676/ [S25] ISSN creatine position stand, PMID 28615996 — https://pubmed.ncbi.nlm.nih.gov/28615996/ [S26] ISSN beta-alanine position stand, PMID 26175657 — https://pubmed.ncbi.nlm.nih.gov/26175657/ [S27] ISSN caffeine position stand, PMID 33388079 — https://pubmed.ncbi.nlm.nih.gov/33388079/ [S28] L-carnitine supplementation in recovery after exercise, PMID 29534031 — https://pubmed.ncbi.nlm.nih.gov/29534031/ [S29] Citrulline malate meta-analysis, PMID 42356270 — https://pubmed.ncbi.nlm.nih.gov/42356270/ [S30] BCAA systematic review, PMID 36177954 — https://pubmed.ncbi.nlm.nih.gov/36177954/ [S31] Garcinia for weight loss, PMID 29317394 — https://pubmed.ncbi.nlm.nih.gov/29317394/ [S32] Green coffee extract meta-analysis, PMID 20871849 — https://pubmed.ncbi.nlm.nih.gov/20871849/ [S33] Tribulus systematic review, PMID 40219032 — https://pubmed.ncbi.nlm.nih.gov/40219032/ [S34] Maca RCT, PMID 36593713 — https://pubmed.ncbi.nlm.nih.gov/36593713/
Full source register in 07_Sources_and_Methodology.md.